Weekly market wrap


Tech earnings deliver, tariff saga continues
Key takeaways:
- This past week, markets were focused largely on two drivers - mega-cap tech earnings and tariff headlines.
- Corporate earnings season overall has outperformed expectations, driven by positive surprises in tech and health care. Last week, artificial intelligence (AI) giant NVIDIA delivered solid results, despite the overhang from trade restrictions in China.
- Meanwhile the tariff tit-for-tat continues. While the courts upheld the U.S. administration's tariff policy for now, there may be more legal headlines in the weeks ahead. Trade negotiations with China also remain strained and have added to market uncertainty.
- Nonetheless, despite the ongoing uncertainty, the S&P 500 is up about 6% for the month of May and is slightly positive this year. Historically, a strong May has boded well for the forward 12-month market performance.
Tech earnings deliver in the first quarter
We know a key driver of stock-market performance is corporate earnings growth – and S&P 500 companies have delivered solid results in the first quarter of 2025, especially in the technology sectors.
Last week's earnings report from NVIDIA, for example, confirmed strong demand for its artificial intelligence (AI) chips, despite the trade restrictions it faces in China. The company exceeded revenue and earnings estimates and grew its data-center business by 73%1. The company underscored that demand from large global technology customers, including Microsoft, Meta and Amazon, continues to drive data-center revenues.
This comes as the mega-cap technology giants earlier confirmed that they will continue to spend on AI this year. In fact, four companies alone, Microsoft, Meta, Google, and Amazon, reaffirmed their capital expenditure for the year of north of $330 billion.
Our take: Overall, the technology sector results this quarter helped alleviate investor concerns that tariff uncertainty and large investments in prior years may slow down the pace of AI spending. In fact, technology companies remain committed to investing in AI and other innovations, and they continue to see potential attractive returns on these investments. The positive earnings reports were also reflected in stock markets, with technology and growth sectors leading the way higher in the month of May.
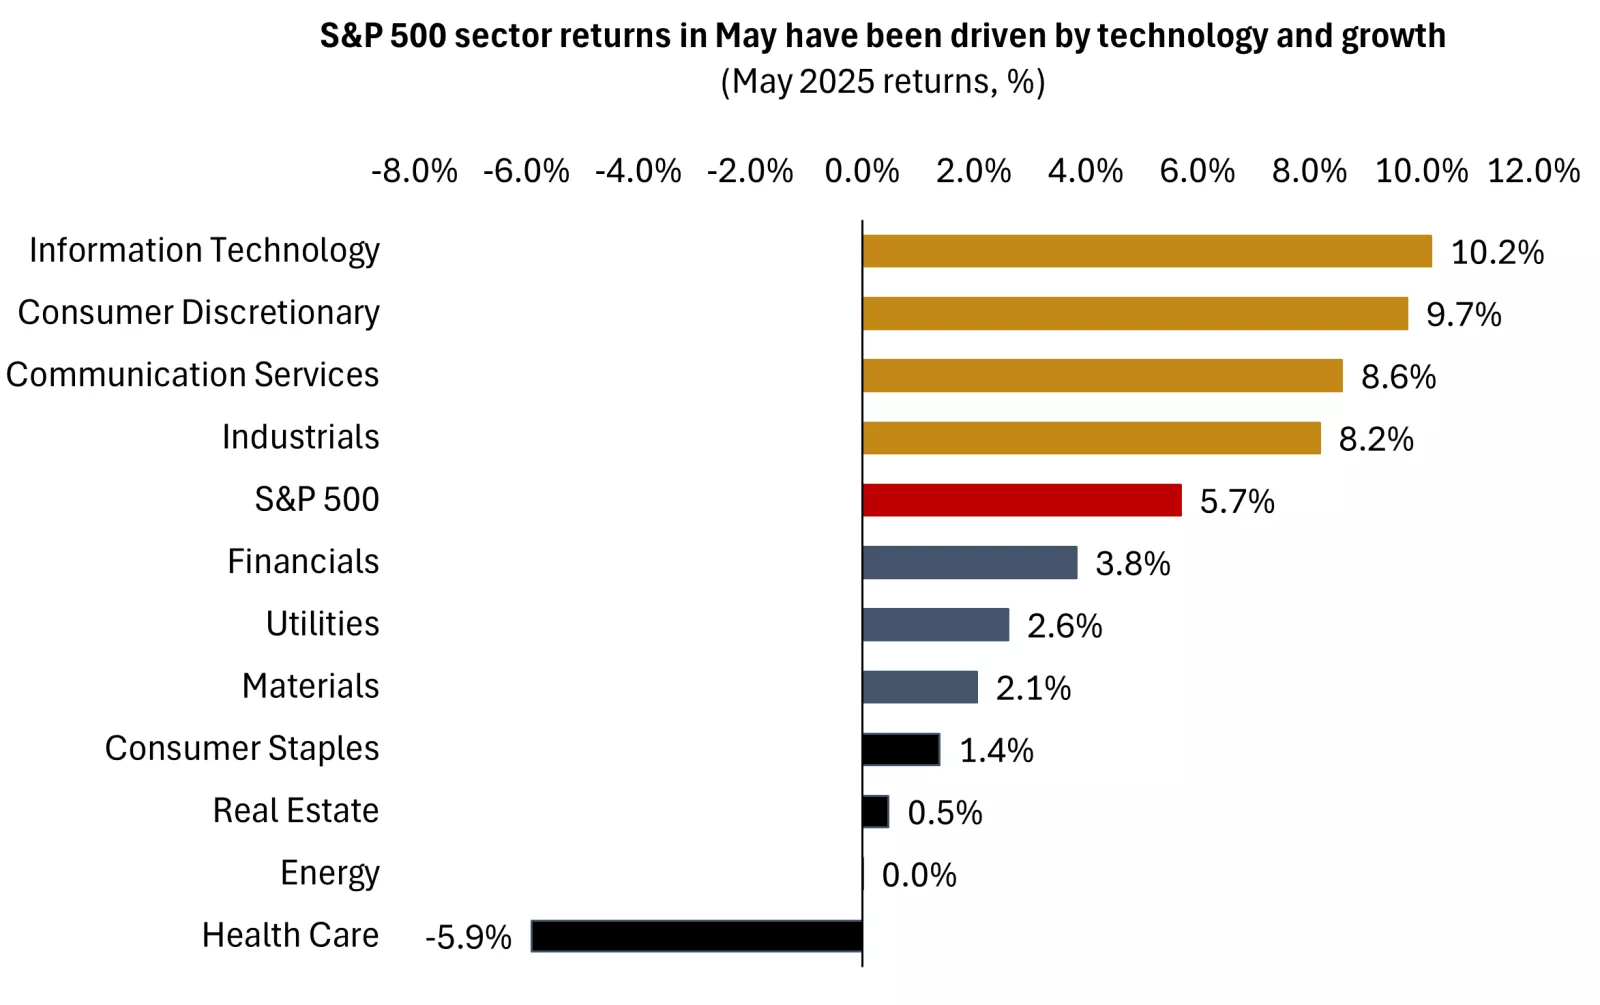
This chart shows the performance of the S&P 500 and GICS sectors of the S&P 500 in May 2025. Past performance does not guarantee future results. An index is unmanaged, cannot be invested into directly and is not meant to depict an actual investment.
This chart shows the performance of the S&P 500 and GICS sectors of the S&P 500 in May 2025. Past performance does not guarantee future results. An index is unmanaged, cannot be invested into directly and is not meant to depict an actual investment.
Corporate earnings growth on pace for mid-single digits in 2025
More broadly, S&P 500 earnings growth remains on track for mid- to high-single-digit annual growth in 2025. While earnings estimates have been revised downward this year as tariff and trade uncertainty have sparked caution in the outlook, investors still forecast positive earnings growth for nine of the 11 S&P 500 sectors.
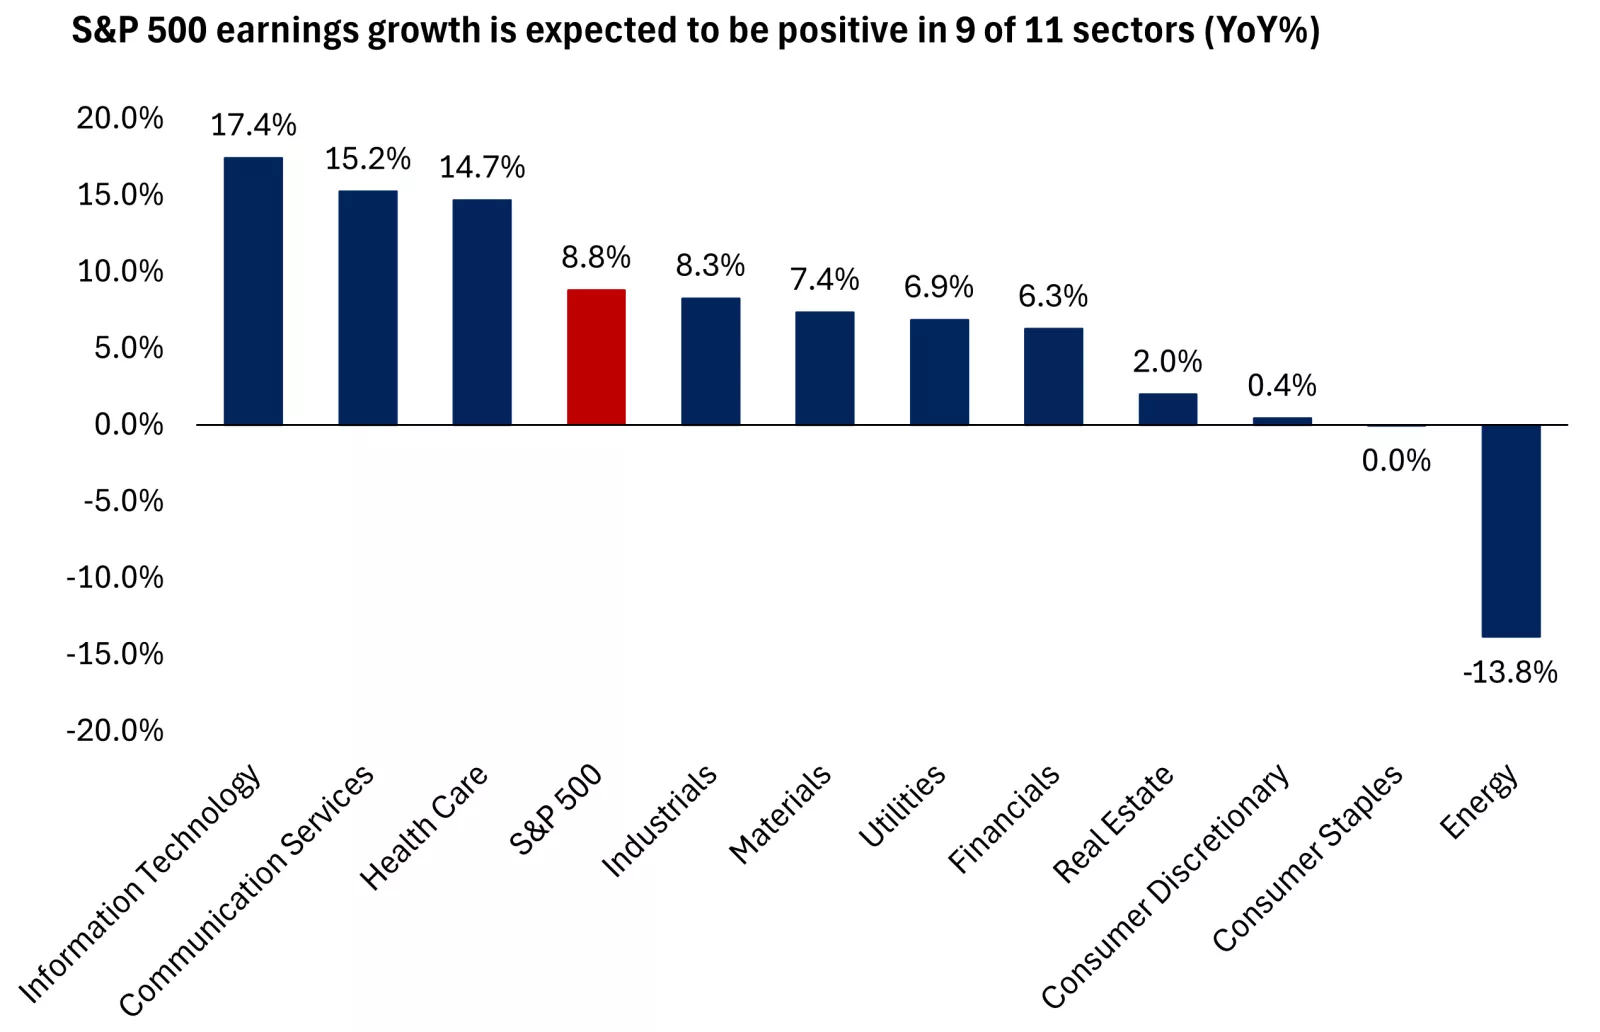
This chart shows 2025 earnings growth expectations for the S&P 500 and GICS sectors of the S&P 500 are expected to be positive in 9 of 11 sectors. Past performance does not guarantee future results. An index is unmanaged, cannot be invested into directly and is not meant to depict an actual investment.
This chart shows 2025 earnings growth expectations for the S&P 500 and GICS sectors of the S&P 500 are expected to be positive in 9 of 11 sectors. Past performance does not guarantee future results. An index is unmanaged, cannot be invested into directly and is not meant to depict an actual investment.
Our take: Corporate earnings have remained resilient for 2025, supported by a solid labor market and inflation rates that have been contained so far. While we would expect some softness in the quarters ahead, especially as companies navigate a higher tariff environment, we don't see the scope for deep or prolonged periods of negative earnings.
We also could see a reacceleration in earnings growth in 2026. This could happen as the Fed potentially cuts rates (albeit modestly) in the back half of the year, a new tax bill goes into effect in 2026, and corporations gain more clarity on tariffs and the operating backdrop. As we know, markets are forward-looking and could start pricing in better news ahead of an actual inflection in growth.
Tariff headlines continue, but investor fatigue may be settling in
While positive earnings surprises were certainly welcome by the market last week, investors also digested a slew of tariff headlines.
Regarding global trade negotiations, there was mixed progress. On the positive side, the administration delayed 50% tariffs on European allies, pushing these to July 9, alongside other major trading partners. However, with China, the White House indicated progress is "a bit stalled," and may require leaders from both nations to come together for next steps. The administration also announced plans late last week to broaden restrictions on China's technology sector, although details remain light.
On the domestic front, a federal appeals court last week overturned a lower court ruling that revoked the Trump administration tariffs imposed under the International Emergency Economic Powers Act (IEEPA). For now, tariffs have been reinstated globally, but further hearings have been scheduled for next week. Ultimately the case could be tried in the Supreme Court, and there are alternatives the administration may consider for imposing much of its tariff policy if needed.
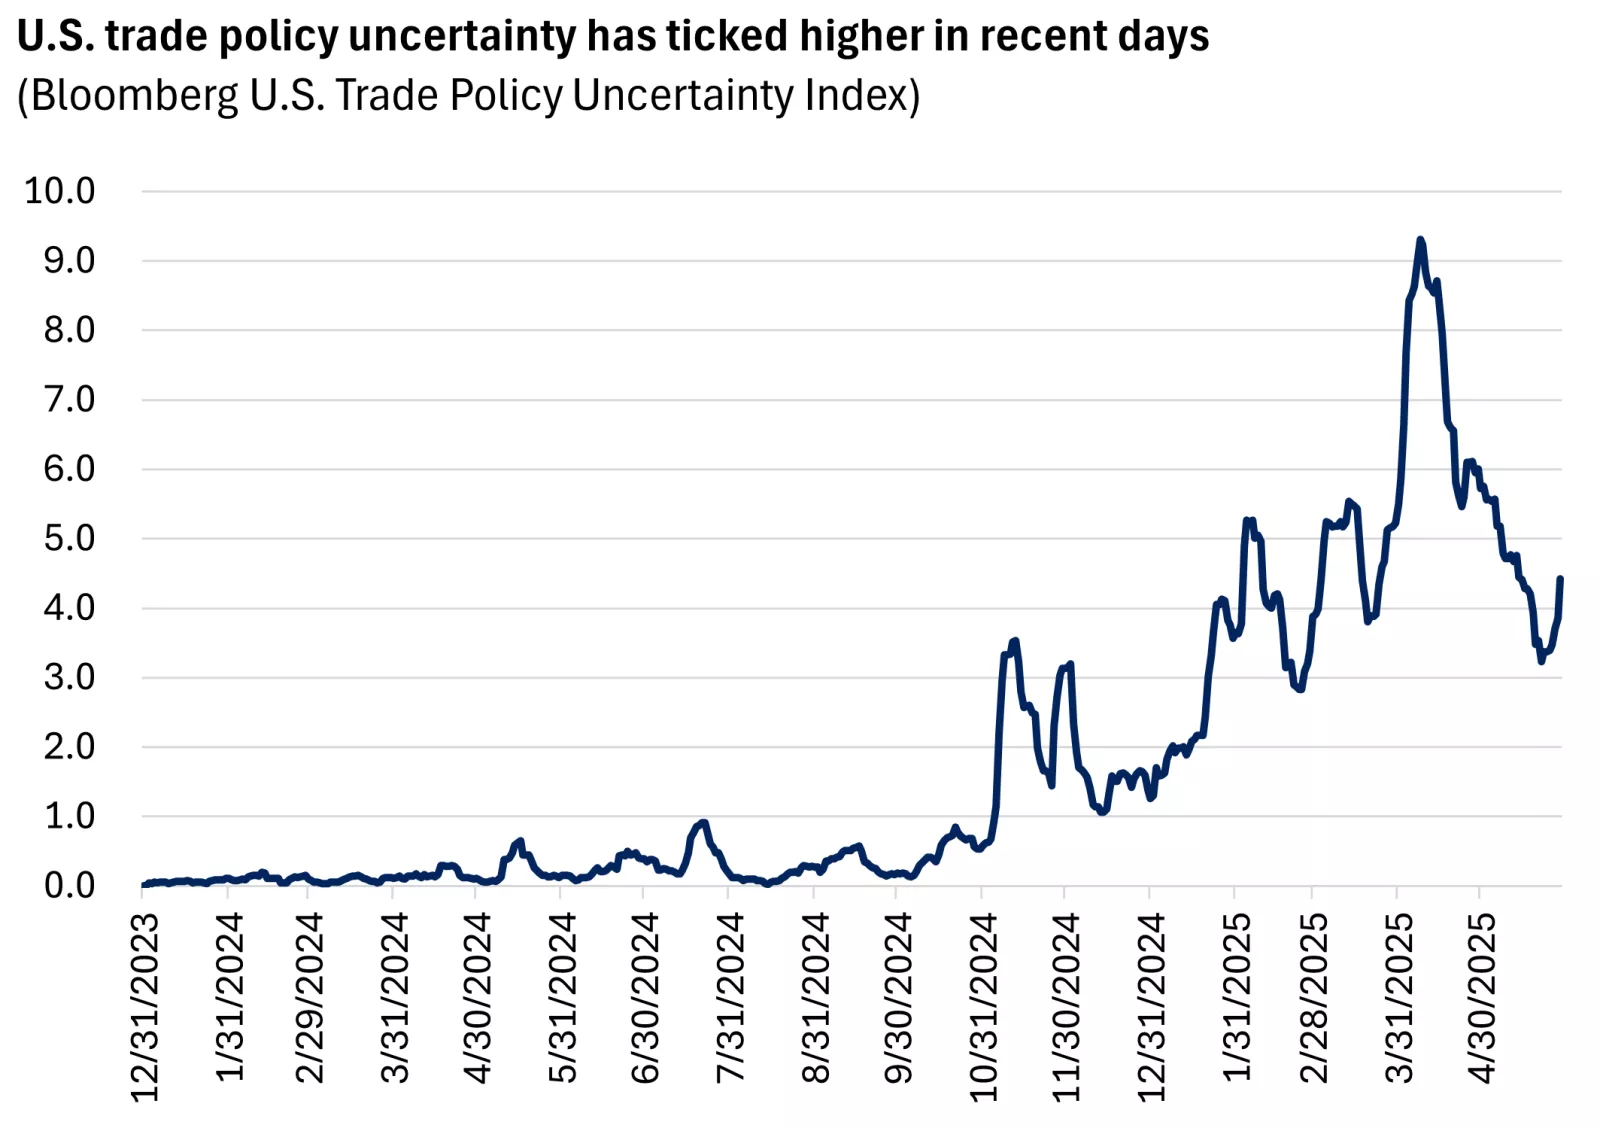
This chart shows that the Bloomberg U.S. Trade Policy Uncertainty Index has risen in recent days after falling from its peak earlier this year.
This chart shows that the Bloomberg U.S. Trade Policy Uncertainty Index has risen in recent days after falling from its peak earlier this year.
Our take: While the tariff tit-for-tat continues, the key takeaway is that uncertainty remains with us for now, and investors may need more patience before a stable trade policy regime is achieved. Perhaps we will get more clarity ahead of the July 9 end of the 90-day pause on tariff rates, as well as the August 12 end of the 90-day pause with China.
Thus far, companies have been able to navigate tariff uncertainty and keep prices contained, perhaps as they have built inventories ahead of tariff-led price increases. We saw this last week as well, with headline PCE inflation (the Fed's preferred inflation measure) coming in at 2.1% year-over-year for April, below the forecast of 2.2% and inching closer to the Fed's 2.0% target1.
In our view, we could see some increase in goods prices, as well as some softening in economic and earnings growth, in the coming quarters as companies adjust to the higher-tariff regime.
However, peak tariff rates and peak fear are likely behind us, and assuming the administration can negotiate deals with its largest trading partners, we should see better economic data heading into 2026, in our view. This could be supported by a lower fed funds rate and fiscal stimulus from a potential tax bill as well.
No “sell in May” this year - stay invested, stay diversified
The old Wall Street adage states, "Sell in May and go away." However, this year investors did just the opposite. We saw a nice bump in performance in May, with the S&P 500 rising about 6% (after falling nearly 6% in the first four months of the year)1.
Historically, since 1980, there have been six times that the S&P 500 moved higher by 5% or more in May. In all six cases, the market was higher in the next 12 months following this move. Overall, while history may not repeat itself, it could certainly rhyme.
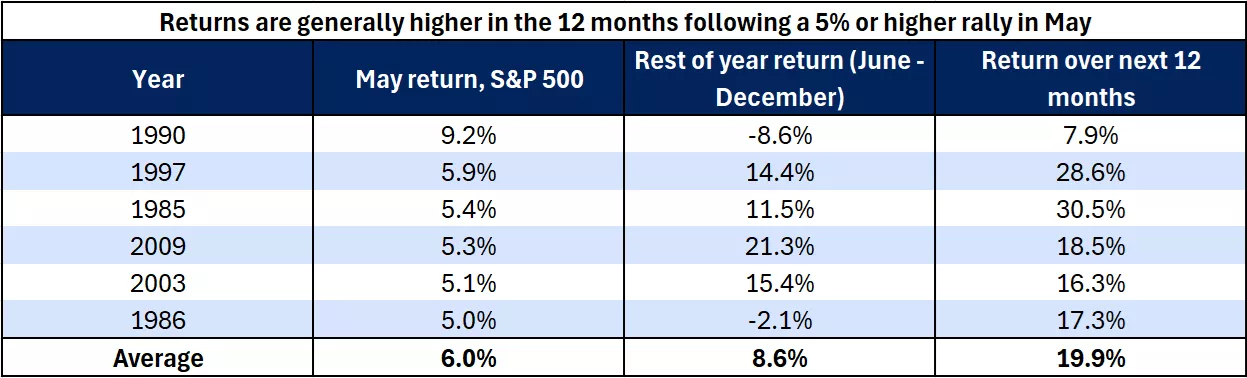
This chart shows that since 1980, when returns have been 5% or higher in May, the average return from June - December in that year has been roughly 8.6%. The average return over the next 12 months has averaged nearly 20%. Past performance does not guarantee future results. An index is unmanaged, cannot be invested into directly and is not meant to depict an actual investment.
This chart shows that since 1980, when returns have been 5% or higher in May, the average return from June - December in that year has been roughly 8.6%. The average return over the next 12 months has averaged nearly 20%. Past performance does not guarantee future results. An index is unmanaged, cannot be invested into directly and is not meant to depict an actual investment.
Volatility may create opportunities
Since its April 8 lows, the S&P 500 has climbed over 18%1. After a strong run, we could see volatility in the months ahead, as higher prices and slower growth could weigh on markets. However, as we look toward 2026, we see a potentially better setup: Economic growth may benefit from both monetary stimulus in the form of a modestly lower fed funds rate, and fiscal stimulus, in the form of an approved tax bill.
In this backdrop, we continue to recommend that investors stay invested and stay diversified. We remain overweight U.S. large-cap and mid-cap stocks, which could benefit from higher earnings growth next year. From a sector perspective, we recommend balancing technology and growth sectors with areas like financials and health care, which are less exposed to tariffs and should do well if economic growth re-accelerates, in our view.
As we approach midyear, now is a good time to reach out to your financial advisor to help ensure your investments are on track to achieve your personal long-term financial goals. You can also work with your advisor to establish plans during periods of market volatility, to rebalance, diversify, or add quality investments at better prices.
Mona Mahajan
Investment Strategist
Source: 1. FactSet
Weekly market stats
| INDEX | CLOSE | WEEK | YTD |
|---|---|---|---|
| Dow Jones Industrial Average | 42,270 | 1.6% | -0.6% |
| S&P 500 Index | 5,912 | 1.9% | 0.5% |
| NASDAQ | 19,114 | 2.0% | -1.0% |
| MSCI EAFE * | 2,600.33 | 0.8% | 15.0% |
| 10-yr Treasury Yield | 4.39% | -0.1% | 0.5% |
| Oil ($/bbl) | $60.92 | -1.0% | -15.1% |
| Bonds | $98.10 | 0.9% | 2.3% |
Source: FactSet, 5/30/2025. Bonds represented by the iShares Core U.S. Aggregate Bond ETF. Past performance does not guarantee future results. *Morningstar Direct 6/1/2025.
The week ahead
Important economic releases this week include nonfarm payrolls for May and ISM PMI data.
Review last week's weekly market update.
Mona Mahajan
Mona Mahajan is responsible for developing and communicating the firm's macroeconomic and financial market views. Her background includes equity and fixed income analysis, global investment strategy and portfolio management.
She regularly appears on CNBC and Bloomberg TV, and in The Wall Street Journal and Barron’s.
Mona has a master’s in business administration from Harvard Business School and bachelor's degrees in finance and computer science from the Wharton School and the School of Engineering at the University of Pennsylvania.
Important Information:
The Weekly Market Update is published every Friday, after market close.
This is for informational purposes only and should not be interpreted as specific investment advice. Investors should make investment decisions based on their unique investment objectives and financial situation. While the information is believed to be accurate, it is not guaranteed and is subject to change without notice.
Investors should understand the risks involved in owning investments, including interest rate risk, credit risk and market risk. The value of investments fluctuates and investors can lose some or all of their principal.
Past performance does not guarantee future results.
Market indexes are unmanaged and cannot be invested into directly and are not meant to depict an actual investment.
Diversification does not guarantee a profit or protect against loss in declining markets.
Systematic investing does not guarantee a profit or protect against loss. Investors should consider their willingness to keep investing when share prices are declining.
Dividends may be increased, decreased or eliminated at any time without notice.
Special risks are inherent in international investing, including those related to currency fluctuations and foreign political and economic events.
Before investing in bonds, you should understand the risks involved, including credit risk and market risk. Bond investments are also subject to interest rate risk such that when interest rates rise, the prices of bonds can decrease, and the investor can lose principal value if the investment is sold prior to maturity.